Monday, July 31, 2006

Snap-On - Is the Value Cavalry Coming?


Snap-On Inc (SNA) is one of those great brands that seems to have lived mostly on its legacy, its great brand name, and has shown glacial improvement over the years. Its manufacturing efficiencies seem to be improving after many years of seeming neglect. Lots of room to improve yet. Its dealers seem to experience a lot of turnover, a problem that the company has addressed for some years. The dealer count dropped 5% in 2005, not exactly a glowing endorsement of the model. Because of dealer turnover, the company seems to be in a continuous struggle to find new dealers, and consequently, sales suffer.


SNA manufactures branded hand tools and diagnostic devices and equipment to automobile service professionals. There are over 14,000 products in its catalog.The Snap-On man sells as he always has to auto mechanics who he visits on his regular route. The commercial and industrial group sells directly and through distributors to transportation service, industrial, educational, construction and electrical businesses.


Growing complexity of automotive repair drives the automotive diagnostic business. The company achieves customer brand loyalty by its involvement with mechanic’s training...some 7 of 10 auto mechanics train with SNA equipment and tools.


This is a global enterprise with 63% of sales in North America, 30% in Europe, 1% in Emerging Markets, 4% in Australia/Japan, and 2% in Latin America.


In an amended 13D filing on the company, ValueAct Capital, a group I very much admire, disclosed a 6.6% (3.842 million share) stake in the company, which is up from the 5.4% stake the firm disclosed in the original 13D filing in November of last year. Please see 13_D Tracker. Is this the Value Cavalry that will rescue long time shareholders from the quagmire? Why quagmire?


19962001TTM
Revenues$1,485.3$2,095.7$2,354.1

Operating


Income

$220.5$100.3$173.1

Operating


Margin

14.85%4.79%7.35%
E.P.S.$2.16$0.37$1.65
Free Cash Flow$77.4$110.1$187.7


Revenue growth in the last five years has compounded at merely 2.35%.Operating margins remain at about half the levels of ten years ago, but have made some slight improvement since the bottom in 2001. Free cash flow has imroved substantially, where FCF margin currently runs at about 8% of sales.


TTM2004200320022001
Return on Equity8.2%7.4%7.8%13.0%9.1%
Return on Capital6.9%6.2%6.0%9.5%5.8%


Returns on Capital have improved somewhat, but remain well below that of other companies in similar businesses such as Danaher which has a ROIC of 15.1% or Stanley Works with 11.8%. Returns on equity are also below those of DHR or SWK.


The company has bought back $220 million of stock in the last two years relative to issuance of $176 million, for a net buy back of about $44 million.This compares to essentially nil prior to the last two years. Five year compounded growth in the dividend has been merely 1.25%.


The recently reported second quarter surprised the Street on the upside, with operating margins at 9.1%.


I believe that this business is capable of far more, and clearly, management is starting to accelerate the pace. Historically, this has been a business that was capable of producing returns on equity at 20%. Perhaps, the Value Act management will use its moral suasion and influence to instill more rapid change.


Disclaimer:Neither I, my family, nor clients have a current position in Snap-On Inc., Danaher, or Stanley Works.
Sunday, July 30, 2006

Returns Accrue When Accruals Don't

As many of you may know, I hold the CFA (Chartered Financial Analyst) designation. I am very proud to have completed this rigorous program. For many of us, the deeper learning and understanding only begins after this point. Continuing education through seminars, workshops, abstracts, and our professional journal, The Financial Analysts Journal (FAJ) is available. For those who are serious about investing as a career, it is the credential of choice. Please contact the CFA Institute, for further information.

In two interesting articles in the current FAJ, the issue of earnings quality is examined. Previous pioneering work by Richard Sloan indicated that net operating cash flow is more closely associated with future income and stock returns than accruals. His work examined annual accruals.

In the current edition, Joshua Livnat and Massimo Santicchia looked at quarterly accruals and found that what has become known as the "accrual anomaly" applies to quarterly information as well. "Companies with extremely high (low) current quarterly accruals have significant and negative (positive) abnormal returns through the subsequent four quarters." In other words, stocks with earnings which show high accruals tend to provide low returns. In the second article, Qiao Liu and Rong Qi study the persistence of the accrual anomaly and why sophisticated investors have not taken advantage of this mispricing.

What are accruals and how can the average lay investor use this fact?

Accruals arise from GAAP...say a business expects great future sales and buys a pile of inventory to sell for future periods. It guesses wrong. In the calculation of earnings, the cost of inventory sold is matched against revenues generated. However, the excess inventory remains an asset on the balance sheet. In the operating section of the cash flow statement, the effect of the accumulation of excess inventory is a use of working capital that can be seen as a reduction in net operating cash flow.Accruals can be current operating assets and liabilities such as inventories, receivables, and accounts payable, but non-current operating accruals exist as well such as deferred taxes.

In short, most investors tend to view earnings reports quite literally and treat all aspects of reported earnings as having equal value, even though the accrual component of reported earnings has been demonstrated to be less reliable, and consequently have less value than the cash component.

How do you find out about accruals? Cramer will not scream them to you nor will Maria Bartiroma breathe them at you! You've got to dig for them yourself.

Go to the 10-Q in Edgar or in some cases, to the press release of the company. Ensure that net income for the period is less than cash flow from operations.

A quick and dirty solution to looking at cash flow from operations comes from Anumati.com. A free registration is required.Enter the symbol and turn to the cash flow statement for the appropriate period. Compare the top line, "Net Income" versus the bottome line of the operating section, "Cash From Operating Activities." Companies with very high accruals will show net income greater than Cash Flow from operating Activities.

In truth, the analysis of the CFFO is a little more intensive than this. Various components of cash flow from operations (which in the past, have arisen from tax effects of stock options) may complicate or overstate CFFO.

But as a first step toward better understanding the economics of the business in which you invest, this is important analysis.

When accruals tend to be low, returns tend to be higher than one would expect. When accruals are high, the market values these "earnings" as having lesser quality, and returns are lower than one would expect.

In short, returns accrue when accruals don't!

Wednesday, July 26, 2006

Waters Corporation (WAT)

Let me initiate my commentary with an apology. I have been terribly busy with a work project and time has been precious. Professional portfolio management is composed of two parts, (#1) Doing whatever it is you do, and (#2) Expaining to the your clients and their consultants (especially these) what it is, you've done. For some of us, there is a third component (#3) Marketing of your services. I have been busy with numbers 1 and 3, I have been preparing for # 2.

Earnings season, despite the complete disdain with which I view most quarterly releases and investors' over-reactions one way or other, is a huge time expense. Conference calls deteriorate into too many hallelujahs and "Nice quarter guys!" Earnings surprises create craters or peaks...long term perspectives are easily lost. As you know, I like the long term perspective. Short term noise and volatility builds commissions, long term perspectives build wealth.

The blog has suffered and I apologize to all of you. Let's get back on track.

Waters (WAT) is one of the leaders in designing and manufacturing scientific analytical instruments, especially in the areas of liquid chromatography,  mass spectrometry, and thermal analysis. These instruments provide enabling technology for environmental studies, for chemistry and for pharmacology. The instruments detect, identify, purify, and measure a full range of compounds. Putting things into a financial  perspective, this is a business that has generated a median return on invested capital of 25.6% in the last five years. Nice!

Waters got clocked yesterday by over 7% following the reporting of its 2nd quarter ended July 1. The market's reaction yesterday was somewhat perverse given the slight improvement in operating margins (50 bp) to 21.8% and an organic growth rate (ex foreign translation) of 9% or 7% with the forex. Operating margin was below some Street expectations and below the TTM 24.1% level.

From a cash flow perspective, the company generated free cash flow of $51 million post capex of $14.7 million. In terms of working capital, accounts receivable turnover showed slight improvement but inventories grew by $15 million which management categorized as $4 million in new Mass spec, $3 million in liquid chromatography, $3 million in forex effects, and $2 million in deferred shipments. The build up in new products in inventory is understandable, the deferral of orders, similarly, is no big deal.

The company also raised its E.P.S. guidance for the year slightly to $2.36 ex-stock options expense, $2.15 with stock options expense. Most companies' earnings would certainly be improved if we eliminated salaries and other compensation, and I regard stock options expense as real and genuine as I do any other compensation. On an apples to apples basis, the management is suggesting 18% EPS growth on a 8% lift in revenues for 2006 over 2005...good operating leverage.

The company did report that there was a double digit sales decline in the first half of the year to its US pharmaceutical clients, but that it anticipated that spending in U.S pharma will improve for the second half.

Some of the underlying trends were particularly interesting. In terms of Asia beyond Japan, namely India and China, sales were up by 36%. U.S. sales declined by 2%. Europe was up 2% and Japan was up 6%...clearly global trends in pharmaceuticals and other high value added sciences are going to be of great benefit to this company. In the conference call, the management also highlighted that sales Stateside to CROs and small pharmaceutical and generic companies was going very well.

The company indicated that free cash flow for the year 2006 should come in around $265 to $275 million.

Compare that with its prior free cash flow history:

2005....$247.02
2004....$193.21
2003....$122.42
2002....$181.68
2001....$146.74

The company has been deploying its free cash flow into share repurchases. WAT has a $500 million buyback with $114 million remaining. In the second quarter, the company bought back $80 million of stock, and clearly should complete this program by year end.

The company has introduced a number of exciting (especially to former biophysicists) products which should meet with decent demand. As research labs go, especially around universities and many industries, this tends to be a fourth quarter business. If you have an annual budget, it behooves you to spend it by the fourth quarter lest you lose it.

Liquid chromatography tends to take forever, and WAT has pioneered some very high performance chromatography which operates at nine times the speed of conventional chromatography with improved resolution and sensitivity.

In my view, an interesting way to invest globally in the emerging life sciences markets of Asia with lower risk. A shareholder friendly management that returns capital through effective buybacks and continues to generate significant returns on invested capital.

My valuation is the low $50's.

Disclaimer: I and my family do not have a current position in Waters. However, a number of clients do own a current position in this company.


Thursday, July 20, 2006

SEC Webcast of Press Conference at 5:00 pm Today-Brocade and Backdating

To access webcast and software please use link.

According to the Wall Street Journal law blog,(subscription required) today's press conference will announce developments in the backdating investigations. CNBC's Charles Gasparino reports that both the SEC and the DOJ will announce charges against former Brocade Communications CEO Greg Reyes...the first criminal case in the backdating scandal.

The more you pay, the less you get

A consulting group, Dolmat Connell & Partners reviews CEO pay at tech companies and comes to what may not be a surprising conclusion:

The more you pay in direct compensation, the less performance you should expect!

Overall, in 2005 for tech companies, CEO base salaries increased 3.7%, bonuses, increased 5%, and there was zero change in long-term incentive grant values bringing total direct compensation up by 8.9%.

What did management's deliver to shareholders: Revenue growth fell from 13% to 10%, net income growth fell from 38% to 21%, and total shareholder return fell from 19% to 2%. Comparisons are all 2005 versus 2004.

One encouraging observation, long-term incentive comp fell signigicantly in excess of stock price declines. The conclusion that Dolmat Connell reaches is that there is an increasingly strong link between pay and firms' financial results.

Stock options are still the most popular long-term incentive employed but only 34% of firms have chosen to use only stock options. Some 53% of firms provided a "portfolio" of incentives, of at least two among (options, performance shares, performance units, restricted stock.)

The value of stock option grants, despite the hardening of the accounting rules, has gone up to 44% of total comp from the 42% level of 2004. Cash comp as a percentage of total comp fell to 36% of total comp versus 43% in 2004.

I share their conclusions: Bonus plans need to balance the upside oppotunity with a real downside risk. Incentives should truly align the incentive scheme that links the performance of management with the performance of the company.

Backdating Options

One of my readers has highlighted a blog that focuses on analysis executive compensation and other governance issues.

Please check out Mukund Mohan's blog: http://blog.vangal.com

He has done some really terrific work on executive options backdating, the potential costs associated with the practice, as well as D&O insurers that may feel the sting of the scandal. For example:

Current Estimate of Economic Impact of Options Backdating


Wednesday, July 19, 2006

Backdating of Executive Stock Options

In the just released report of Heron and Lie from Indiana University and the University of Iowa, the extent of the backdating or manipulation of option grants to top executives is estimated for the period of 1996-2005.

Their research prompted the Wall Street Journal to undertake research that identified dozens of suspect firms and at this point, at least 50 firms are being investigated by the SEC. Their study focused on unscheduled, at-the-money option grants, a total of 39,888 stock option grants to top executives. By granting options at-the-money, there are no tax implications for the executives at the time of the grant. If options are granted at prices in excess of the current market, there is little incentive to backdate.

The SEC had tightened reporting regulations on August 29, 2002 requiring executives to report stock option grants they received within two business days. For grants that were filed after this date, that were filed on a timely basis, the incidence of backdating was 7%. For grants filed late it was 19.9%! Even in 2005, only 87% of option grants are filed on time.

However, the period prior to August 2002 showed the egregious conduct of some managements. The authors estimate that 23% of unscheduled, at-the-money grants were backdated.

Grant manipulation was more prevalent among firms that are small, operate in the tech sector and have high stock volatility. Manipulation is more likely when large numbers of options are granted and there are numerous recipients.

The numbers are shocking. Here are the percentage of options that were backdated prior to August 2002:

Grants by low-tech firms...........................23.0%
Grants by high-tech firms.........................20.1%
Grants by small firms................................23.1%
Grants by medium firm.............................27.0%
Grants by large firms.................................15.4%
Grants by firms with low stock volatility....26.2%
Grants by firms with high stock volatility...29.0%

Post August 2002
Grants filed on time....................................7.0%
Grants filed late..........................................19.9%

Call me naive, but I am shocked and dismayed to see that 20% of current option grants are still subject to backdating.

Sunday, July 16, 2006

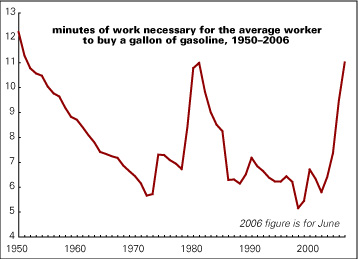
An Interesting Chart re Gasoline Prices


Source: www.leftbusinessobserver.com

An interesting way to view gasoline prices. Playing with numbers, if your commute is 10 miles each way, and you get 15 miles per gallon of consumption with your SUV for stop and go city driving, your Monday to Friday commute will cost you 6.67 gallons of gasoline. According to the chart, on an average salary, this consumption amounts to about 73 minutes of your salary, or about 3.0% of pre-tax earnings. This is before maintenance and depreciation of your vehicle.

Merck and Vioxx- Is the Street Pricing the Liability Correctly?

Contingent liability is always a difficult aspect of analysis for investors. Tobacco liability, and asbestos liability had a huge impact on valuations for companies with these exposures. Resolution of these difficulties can result in stellar performance...ongoing uncertainty however, hangs like a cloud.

Similarly in the healthcare industry, the Dalkon shield IUD caused A.H. Robins to declare bankruptcy as it was overwhelmed with lawsuits. There were 12 deaths due to miscarriage-related infections in a population of 2.8 million women that had used the Shield, so the risk of death was infinitesimal...in fact, the rate of pelvic infection among IUD users was lower than that for women using no contraceptive at all. The cost of the anti-obesity drug Fen-phen liability for Wyeth was some $20 billion!

Contingent liability is no trifling matter.

Following this week's victory (known as the Doherty case) in Atlantic City, NJ, Merck (MRK) has won four of the seven cases that have been tried relating to Vioxx. Plaintiffs won two of the three cases in Texas, MRK won three of the four cases in NJ, MRK's home state. The company continues to face some 13,000 cases and had reported in its first quarter that cases had increased by some 19% versus the prior quarter, a deceleration from the fourth quarter rate of +51%.

Year to date, MRK is up 13.6%...it seems that most investors have put the Vioxx liability risk on the shelf. The Doherty case was important since Ms. Doherty had been taking the drug for three years, much longer than the adminsitration of the drug in prior cases. Consequently, MRK could not use its prior defense that anyone taking the drug for 18 months or less would not have elevated risk, based on its previous studies. The jury decided that there were other risk factors that could have contributed to Ms. Doherty's heart attack.

In some excellent work by David Moskowitz and Stephen Williams of Friedman Billings Ramsey, they point out that in two of the three cases that MRK lost, the cases were brought on behalf of a deceased plaintiff. In the third case that MRK lost, the plaintiff was confined to a wheelchair.Among the other four plaintiffs which lost their cases,three of them appeared relatively healthy. The exception was a deceased plaintiff who appeared to have taken Vioxx for less than one month.

In the FBR report, several scenarios are portrayed. Continued litigation is expensive, but many cases may not be deemed of merit...in one optimistic scenario, the analysts assume that only 25% of cases are "of merit" and MRK continues its 4 for 7 victory "batting average." The impact on per share basis is $6.36. A more bearish but equally plausible scenario ups the ante to $23 per share.
The analysts suggest that a class action settlement may be the preferred option for reducing the opaqueness and uncertainty of this case, as well as for limiting the damages. This still represents a $14.2 billion settlement, which includes some $750 million in litigation costs. According to the first quarter Q filing, MRK has already spent $285 million on its defense, which on a per share basis is 13 cents.

There is a full slate of upcoming product liability trials that will be in the news over the rest of this year. Some less friendly venues than TX and NJ will be seen, California, Louisiana, Mississippi, and Alabama.

It is also noteworthy that there may be a final rush to file last-minute lawsuits coming up on September 30th, the two-year anniversary of when MRK pulled Vioxx off the market. Please check link:
Latest Win Supports Merck Strategy of Fighting Each Vioxx Lawsuit

One item of information that seems to have been overlooked by most investors did arise from the Doherty case. Though the FBR report does mention it, few other analysts seem to have noticed. This is mentioned in a Boston Globe article (free registration required) as well as "The Settlement Channel," a highly readable blog of settlement cases.

"However The Globe also points out something that several other national publications failed to point out in their stories and that is the very surprising fact that Judge Higbee allowed the jury to decide the issue of whether Merck failed to warn the plaintiff about the risks of Vioxx. This is a departure from the usual question as to whether or not the company failed to warn doctors or medical personnel about the risks of the drug. The jury found 7-0 that the company in
fact did fail to warn the individual plaintiff/end user and in the word's of Mrs. Doherty's trial lawyer, Gene Locks, "this is a huge, major, precedential verdict for plaintiffs nationwide because this jury unanimously determined that Merck failed to adequately warn the users of this drug". Defense counsel objected to this charge being put to the jury, felt it never should have been allowed, but there now exists that precedent and I would expect this to get bigger headlines than the
actual case verdict as the weeks go past.
It's a win for Merck but might ultimately be costly in the long run."


Bottom-line, the resolution of the Vioxx liability remains moot and amorphous. Over the last year, MRK is the only US based large cap pharma stock with positive returns, ahead of BMY, LLY, WYE, ABT, JNJ, and SGP, and PFE all of which are negative for the TTM.

On a valuation basis, here is how MRK compares on an EV/EBIT basis for TTM EBIT:

MRK....13.87X
BMY.....11.30X
LLY......21.93X
WYE....12.05X
ABT.....16.56X
JNJ......12.05X
SGP.....38.55X
PFE.....12.27X

Needless to say, there is more to understanding these companies than purely citing this metric. Product pipeline and profitability as well as dividends and share repurchase are important aspects to understand and model.

I am certainly not holding myself out as an expert in tort liability. MRK has embarked on aggressive restructuring, which I have yet to address. MRK's three vaccines appear to offer some near term excitement. Other products address important needs such as Type-II diabetes. But the company continues to face some formidable patent expirations over the next several years.

Merck has unbelievable strength in its balance sheet. As of March 31st, the company had $10.2 billion in cash plus another $2.2 billion in marketable securities, totalling $5.66 per share. The company continues to generate very significant free cash of $1.37 per share for the last TTM.

In my view, investors have become somewhat cavalier about the litigation risks. Some tough sledding remains ahead of the company in some pretty tough if not notorious (at least from prior tobacco experience) jurisdictions. Given the great uncertainty, I would continue to avoid.

Disclaimer: Neither I, or my family have a current position in MRK, BMY, LLY, WYE, ABT, JNJ, SGP, or PFE. However, some clients do have a current position in MRK, BMY, JNJ, SGP, and/or PFE.

Saturday, July 15, 2006

The Horizon is Bright at Bright Horizons

Bright Horizons Family Solutions (BFAM) is a steady eddie grower. The company is known for operating child care centers within corporations. This isn't just babysitting...this is child care and education.

In some ways, BFAM represents an investment in productivity enhancement for its customers. Employer sponsored child care programs drive down employee turnover and reduce absenteeism. Companies reduce the recurring costs of recruiting new employees, and one could argue, enhance the return on investment of their firm. This can be a very strong differenting factor in attracting, recruiting, and retaining employees.

This week's Wall Street Transcript (subscription required) features an interview with Sandi Gleason and Robert Schwarzkopf, portfolio managers at Kayne Anderson Rudnick who focus on small cap investing.

This is a growing market...I have difficulty fathoming how any large company could tell its employees that it was abandoning its child care services. As the TWST interview points out:
"As I mentioned, the child care market is growing, and the onsite,employer-sponsored market is growing more rapidly than the overallmarket. The company has a visible pipeline of new centers. Currently,there are 60 new centers in the pipeline that are scheduled to open overthe next 12 to 24 months. The company has only 100 of the Fortune 500 companies and only 10% of employers currently offer work site childcare, which exemplifies the future opportunities."

The company is the largest operator in this business. Tuitions increase by 4-5% a year and new "stores" grow by 8-10%, hence top line growth of some 15% is feasible. Management believes that it can grow operating margins by 20-50 basis points a year through improved utilization.

The stock, currently about $32 is down some 13.5% YTD and down about 25% for the TTM. Have a look at the ROIC and free cash flow characteristics over the last five Years:

                                  ROIC            FCF(millions)
2005.........................16.8%..........$34.5
2004.........................14.6%..........$24.3
2003.........................13.6%..........$11.6
2002.........................13.9%..........$29.1
2001.........................12.8%..........$10.1

Paying no dividend, the company has continued to reinvest in its growth. However, in 2005 the company began to buyback some stock with the purchase of $11.23 million in stock, a net purchase of $4.8 million. So far this year, this has accelerated with the repurchase of $34.25 million in stock resulting in net reduction of about $32 million. Fully diluted shares outstanding are 28.02 million versus a peak of 28.56 two quarters ago.

Given the free cash flow characteristics, the balance sheet is clean with very little long term debt.

On a valuation basis, the company with an Enterprise Value of about $870 million, is trading at 13.6 times EBIT for the last twelve months, a reasonable multiple for this profitability and for this quality.


Disclaimer: Neither I, my family, nor clients have a current position in BFAM.


Gimme Shelter But Not from Inflation

Are capital markets facing cyclical exhaustion? Are inflationary pressures overwhelming us?

As markets think about the Middle East tensions, as oil prices skyrocket, our capital markets seem to cringe. Global real interest rates are lifting while global liquidity seems to be falling. Macro risks are being re-priced to reflect these concerns.

The rising uncertainty does little to capture investor interest, let alone bravado. Earnings growth, at least based on what I have seen so far in earnings season, is slowing after a long spell of double digit earnings growth (for the S&P 500, it's been 11 quarters.)

The S&P lost 2.31% for the week with only energy (+2.49%) and utilities (+0.28%) rising. Particularly hard hit were consumer discretionary stocks (-4.53%) and information technology (-4.68%) But of note, industrials (-3.73%) and materials (-3.23%) were both poor performers. The underlying message to me is that the market is not sensing a surge in inflation. Despite, oil prices, neither am I. Natural gas prices are reflecting $35 oil not the current $78 world price. My belief is that the "real" price for energy that the economy will "see" is closer to that $35 price,

Some interesting additional information about the business outlook comes from the recent business outlook survey of NABE (National Association of Business Economists.) I am, in fact, a member, the only economist hat that I wear.

In their survey, there is some interesting commentary on price increases. Pressures on prices had eased somewhat from prior quarters. For July, the percent that reported prices rising was 27% down from April's 41%. In fact, 69% reported prices unchanged. Another interesting result related to 61% of those surveyed indicating that price increases in the second quarter that were attempted were "unsuccessful" or only "partially realized." The share that reported price increases as being "fully realized" was 29%, the lowest in over a year.

I am beginning to think that Ben Bernanke's tightening is done. Wednesday's release of CPI for June will be critical to markets, obviously.

The consensus viewpoint is that we are in a period of ongoing cyclical sector leadership with continued earnings growth particularly from that sector. I am not that sure. The world economy, to some degree has been sheltered from the impact of energy prices. Just recently, China announced that it was raising domestic gasoline prices for the second time this year. State-run economies have difficulty in sheltering themselves over an extended period from world oil prices. Tightening of monetary policy has been a worldwide phenomenon even including Japan putting an end to its zero interest rate policy. My suspicion is that we will see a slowdown globally from what has been five years of above-average growth.

What to do? Gimme shelter. Look for less economically sensitive sector exposure to your portfolio. Look for predictable, slower growing companies. Consumer staples and healthcare come to mind.

This week's Barron's has an interview with Larry Haverty of the Gabelli Multimedia Trust. In his view, the U.S. is in a consumer recession. As he mentions, WalMart had 1% same store sales gains for June, restaurants (check out our CBRL thoughts) are missing estimates, and MMM lowered forecasts. Though a hard landing for the consumer is possible, he and I are more optimistic. He suggests three different kinds of stocks:

  1. Unscathed Entities-Phenomenal businesses with terrific fundamentals. He suggests YHOO, STN, NWS, LVS, AAPL, and BBY.
  2. Mispriced Value-He suggests HD, and SSP
  3. Companies Gaining Higher Share of Spending- He suggests gaming stocks such as MGM , HET, BYD, or PNK.
It's been a tough start to the quarter for most of us. In a slowing consumption period, there is downside in a lot of the consumer discretionary names. Stick to financial quality, stay larger cap, seek predictable growth. Again, this should be a good environment to switch into consumer staples and healthcare names. My suspicion is that the cyclical game is in its late innings. Industrials generally seem fully priced and may well have some significant downside in a slowing economy. Similarly, I would (and have) reduced my exposure to beneficiaries of inflation in the resource area. About the only aspect of this sector that still intrigues me is the paper and forest products.

Disclaimer: Neither I. nor my family have a current position in any of the stocks that were mentioned in this post. Some clients do have a current position in HD, and HET.

Friday, July 14, 2006

Buyout of Petco and its Impact on PETsMART

Petco (PETC) announced this morning that it was being acquired in a $1.8 billion offer from Leonard Green Partners and Texas Pacific. The $29 all cash offer represents a 49% premium over last night's close.

In a recent post, we had highlighted the superior operating and financial performance of PetSmart (PETM). Please see:

PetSmart versus Petco- The Debate

In this post, we had highlighted how concerns about value pricing strategies of Petco were impacting the valuation of PetSmart.

Interestingly, this is a bit of deja vue...the buyers are the same financial sponsors who had IPO'ed PETC in 2001 having purchased it two years earlier.

In my view, this is positive news for PETM. A major competitor, given its LBO capital structure, will have to be operated primarily for cash flow. Major capital expansion plans at Petco will likely need to be shelved, at least for some time. Typically, an LBO'ed competitor tends not to engage in pricing battles...at least not the kind that Wall Street feared.

Based on the metrics of the PETC deal (about 8.2 times EBITDA forecasts for 2006,) PETM would be valued at about $4.1 billion enterprise value, compared to last night's $3.3 billion valuation. On a per share basis, this translates to about $29 per share for PETM.

However, given the superior economics that PETM has demonstrated, the impact of PETM's remodelling program, as well as the expansion of its pets' services businesses, I believe there is substantial upside to PETM's operating margins and consequently, its valuation. Its major competitor has operated with a highly leveraged balance sheet after its first LBO. At that time (2001-2002) debt represented essentially all of invested capital. Interest coverage was essentially equal to operating cash flow. By contrast, PETM's balance sheet is very clean with debt representing only about 28% of capital. Interest coverage is about ten times for PETM.

Disclaimer: I, my family, and some clients have a current position in PETM. Neither I, my family, or clients have a current position in PETC.


Tuesday, July 11, 2006

WD-40 and the Slippery Slope of Advertising and Sales Promotion

Lots of value investors have admired the brand franchise of WD-40 (WDFC) over the years. In a recent interview with The Wall Street Transcript (subscription required) Bryant Evans of Cozad Asset Management describes the rationale for his holding of WDFC:
"One of the things that we really like about WDFC is that management does a nice job of expanding its product line without losing focus. To some extent, it epitomizes what we're looking for in terms of management skills and marketing within the conservative framework that qualifies a company for our portfolio."

WD-40, known for that little can of lubrication wonder, actually represents nine different leading consumer brands.The lubricants, both WD-40 and 3-In-One represent some 65% of sales, Internationalization is significant as these products are marketed in over 160 countries. Europe represents 29% of sales and Asia-Pacific about 8%.

The stock dropped about 7.4% today despite what seemed to be at least superficially, okay numbers. Let's look a little closer:

Revenue growth was 12.1% reflecting 13.2% growth in lubricants, 12.3% growth in Household Products, and a 16% decline in hand soaps (I may be the last living user of Lava soap!) I thought sales growth looked quite decent reflecting various product extensions that made a lot of sense,,,the WD-40 Smart Straw and No-Mess Pen come to mind. European growth was amazing at over 27% YOY. European sales growth in Household Products was negative at -3%.

Gross margins actually expanded by 50 basis points to 48.5% despite the cost pressures of petroleum based chemical raw materials. But operating income was flat and operating margins were down to about 15% versus some 17% a year ago. The culprit is SG&A which is up to over 25% of sales due to stock options expense and selling and marketing expense. Selling expenses were up to over 8% of sales versus last year's 7% and what historically, had been less than 5%. Management suggested that a range of 7.5% to 9% may be appropriate for the future.

It is easy to lose sight of what advertising and selling expenses represent. In my view, for a brand name company, this is not terribly different than making a capital expenditure that provides you a 100% first year tax write-off. For a brand name company, advertising is an investment in the future. Its effectiveness does not become apparent with immediacy generally, but I do believe that it can be a very worthwhile "investment" rather than "expense."

WDFC management continues to seek acquisition opportunities that meet its ROIC hurdles. Prior to its acuisitions of 1999 and 2000, which brought in the businesses of Lava and Solvol, this was an underlevered firm with ROIC of over 30%. Acquisitions had brought debt to almost 60% of capital by 2001 and the company has steadily improved its balance sheet since then. Debt is down by about $20 million over the last year, down to about $53 million. The company could easily handle a  significant acquisition that employed debt since interest coverage ratios are very high (11 times.) But ROIC is now around 15-16%, slightly above the 13% levels that it reached right after the acquisitions.

The company generates close to $1.00 per share in free cash flow (TTM) at this point and has about $45 million of cash and equivalents on the balance sheet ($2.00 per share.)

The company pays a 22 cent quarterly dividend and has maintained this level since mid-April 2005 having cut its dividend to 20 cents in 2002 from a previous 27 cent level, and as high as 32 cents in 2000. The company has bought back little stock over the years with a net buyback of only $7 million in 2004. Not what I would call being shareholder friendly.

The strategy is somewhat disturbing to long time admirers of the stock. Product extensions are great when they result in sales growth. Geographic expansion is great...imagine every Chinese family with a can of WD-40. Use selling expenses to build your brand...that's great too! But reliance on building a portfolio of consumer brands through acquisitions which have reduced your return on invested capital to just attractive from astounding seems like the wrong approach. The historical acquisition  record, at least in my view, does not create great feelings of warmth and respect. The need to reduce the dividend temporarily was correct and probably required by the indentures related to the borrowings...but let's share the wealth.

From a valuation standpoint, the company is trading at merely 10 times EV/EBIT, a relative "bargoon" to quote Eddie Shack, for a business that produces a 16% ROIC. Superficially, it seems attractive, but the strategy worries me. My conclusion: Statistically attractive, but not with my dough.

Disclaimer: Neither I, nor my family have a current position in WDFC. A number of clients do have a current position in this stock.

Monday, July 10, 2006

Alcoa Kicks off the Q2 Earnings Season ...Hardly World Cup, But Not Bad

Alcoa (AA) brings in the earnings season as a Dow component and has posted some pretty decent numbers this evening.

Though the press services ballyhoo the big 62% profit jump, it is important to keep things in perspective.

As some of you may recall, I have not been a great fan of this company, having preferred Alcan (AL) largely because of AL's energy cost advantages and what I believed to be continuing synergies (forgive me for using that word) from the Pechiney integration. Please see my post:

Alcoa sets Hurdles Low

Cash flow from operations for the second quarter has come in at about $700 million as compared to the corresponding period last year of $384 million. This brings CFFO for the first half of the year to $486 million versus $145 million. Contrast this with earnings for the first half of $1.367 billion versus last year's $720 million. The improvement in CFFO is quite evident, yet still represents, because of working capital needs, a considerably less robust view than GAAP earnings.

Looking at capex, and resultant free cash flow, again, I am somewhat disappointed. Capex for the first half was $1.32 billion resulting in negative free cash flow of $835 million. This is the best that the company can show in a metals market that has screamed? Debt to cap remained steady at 32% within its guidelines of 25-35%.

Looking at individual segments demonstrated some very strong profitability. Alumina, for example showed operating margins of 39%. Primary metals similarly were strong with 30.&% margins. The company has pointed out that 1/3 of the third quarter production is already priced at higher than current price levels.

On the fabricated side, the company disappoints me. Again, despite the very healthy aerospace market, operating margins came in at 3.7% in flat-rolled products. Labor contract related costs have held back profitability presumably as a non-recurring cost. The extruded and end product segment had operating margins of 1.5%. Engineered solutions showed improved operating margins at 7%. Packaging and consumer showed a much improved operating margin versus the first quarter of 4.4%.

I am encouraged by the improved disclosure and transparency in the results. As I have said before, the management takes great credit for achieving what the L.M.E provideth. Natural for a commodity business, I suppose. Yet when I look at the improving volumes of business that the fabrication businesses are seeing relative to the operating margins that are being achieved, I come away disappointed. Results really should be better here.

Returns on invested capital have improved, but are not exactly heady. Management seems please with a first half ROIC of just over 15%. Using somewhat more conventional TTM figures, it looks more like 10% to me.

At the end of today's conference call, the Chairman and CEO, Alain Belda used as his final line, " And by the way guys, this was a great quarter. I would like you to think about it this way."

Sorry, Alain. It was not bad, but at least in my view and I suspect among some others', it wasn't great.

Disclaimer: Neither I, my family, nor my clients own a current position in Alcoa. Certain clients own a current position in Alcan.

Tuesday, July 04, 2006

Turnarounds and Value Investing

It's been great to take a few days off of work, a few days off of blogging! No doubt, fatigue sets in, ideas tend to get outworn or musty, and the bedraggled routine of everyday thinking needs to be revamped. Readers need a break from my mental meanderings as well!

I am very fortunate...I truly love my work largely because it is my own work. As Mark Twain observed, "Cursed is the man who has found some other man's work and cannot lose it." That's one of the best aspects of the investment management business, whether you are pursuing it professionally or for your personal gains...everyone can have their own style of investing. If it represents a discipline that you can formulate and follow, then it has a chance of success. Otherwise, investment management becomes random shots at stocks, a scattergun approach to the market.

One of my mentors used to counsel me, "If you don't know where you are going, any road will do."

Find a discipline that will work for you and that you can be comfortable with. It might not be value investing, the discipline that I follow...and that is perfectly okay! One of my former partners, though he described himself as a value investor, was really more of a technician. He would seek opportunities in cyclical stocks based on charts. His fundamental judgments in non-cyclical stocks were peculiar and rarely rationally based. At least, I couldn't find the rationale. Yet, time and time again, with his particular knowledge of the paper and forest products sector, he could find bargains largely based on charting. Bill of Absolutely No DooDahs has impressed me greatly with the uniqueness of his thinking that combines fundamentals with statistical probabilities and technical analysis...a very broadly based point of view.

This weekend, I've been asking myself. "Can a Buffetteer be involved in a turnaround stock?" If we take a  pure  Joel Greenblatt approach (of 'Little Book" fame), it seems the answer is no. Such companies will not meet the return on invested capital hurdle that Greenblatt requires, at least not for the most recent TTM period. Yet, when we examine some of the companies that Buffett has purchased, there are turnaround characteristics present...most recently Russell Corp. which has a return on capital of barely 2% for the TTM.

 An excellent research piece by Jaison Blair of Rochdale Research which was recently published, clarifies what is needed to "Find Good Businesses When They Go on Sale."

  1. Reversion Toward the Mean- Is current profitability below historical levels? Does the company have a sustainable competitive advantage that is distorted by temporary factors? For example, in WalMart (WMT) have high energy prices permanently affected its target audience?
  2. Depressed Valuation Relative to Normalized Profitability- Plugging in numbers that assume some restoration of profitability, whether based on margins, or return on capital, should result in a bargain price. Evaluating what we know relating to historical performance, industry structure and margins, as well as management's plans should help us assess where profitability ought to be...and what the resultant valuation becomes. For example, many value investors (myself included) have positions in media stocks that look very cheap relative to historical norms. Westwood One (WON) sells at 10.7 times trailing earnings, an all-time low relative to its ten year history; it sells at book value, again unprecedently cheap; it sells at less than 9 times cash flow, agin, not seen in its prior history. But return on capital in the most recent year is down about 2% from  its peak of four years ago...what is normalized profitability for this business?
  3. Conviction that the Situation is Temporary- Clearly, if we believe that an industry's fundamentals have undergone a permanent shift downward, historical numbers have no place in our analysis. Accept the reality and model this in your work. For example, I do not believe that terrestrial radio is finished as a business, nor do I believe that returns on invested capital will be permanently stuck at these levels.
  4. Does Management's Plan to Restore the Business Make Sense?- Is the plan sensible, and do we believe that management can execute based on historical performance and industry conditions?
  5. Financial Strength to Weather the Storm- Respect the downside. Is there sufficient balance sheet strength to survive a war, let alone a battle, or is there potential for resource conversion such as sales of assets or subsidiary businesses that could bolster the balance sheet if the turnaround falters? Is there evidence of debt being paid down or improvement in working capital management?

The absolute ideal investment is buying something that is great at a fair price. "Iscar" was such an investment for Berkshire. But, leave room in your thinking for the Russell's of this world...for the currently downtrodden, but only temporarily flawed business. Being involved in something that has a little hair on it can be highly profitable.

Importantly though, I do not believe that assessing a turnaround allows much flexibility in the above criteria. I think having just four of the five criteria met is not good enough! You really need all five. A depressed price relative to "Normal" profitability is great but if there is no plan to restore profitability from a credible management team, what have you got? The answer...a permanently depressed stock. As I like to say, "Presents excellent value, and likely to stay there." If there is no balance sheet to count on, tomorrow may never come.

Turnarounds can be tricky. They invariably take longer than you expect. Having too much exposure to a turnaround strategy will subject you to perhaps more risk than you anticipate despite having what at least superficially appears to be a diversified portfolio. Given the vagaries of markets and the short term sensitivity of many players, an ill-timed turnaround can play havoc with your results.

But don't exclude turnarounds from your investment strategy. Excellence is rarely priced cheaply. When it is, jump on it. Great companies which are fairly priced, provided they can maintain their competitive advantage and consequently, their "greatness" are where most of your portfolio should reside. Finally, a few turnaround candidates can provide outstanding returns when they work, and annoyance and disappointment as they "just sit there." Or worse. But the rewards more than compensate for the risk when the above criteria are followed.

Disclaimer: I, my family, and most clients have a current position in Berkshire Hathaway. I, my family, and most clients have a current position in Westwood One and are patiently awaiting the turnaround!


< ? Market Blogs £ >